Notifications (Email/SMS)
Overview
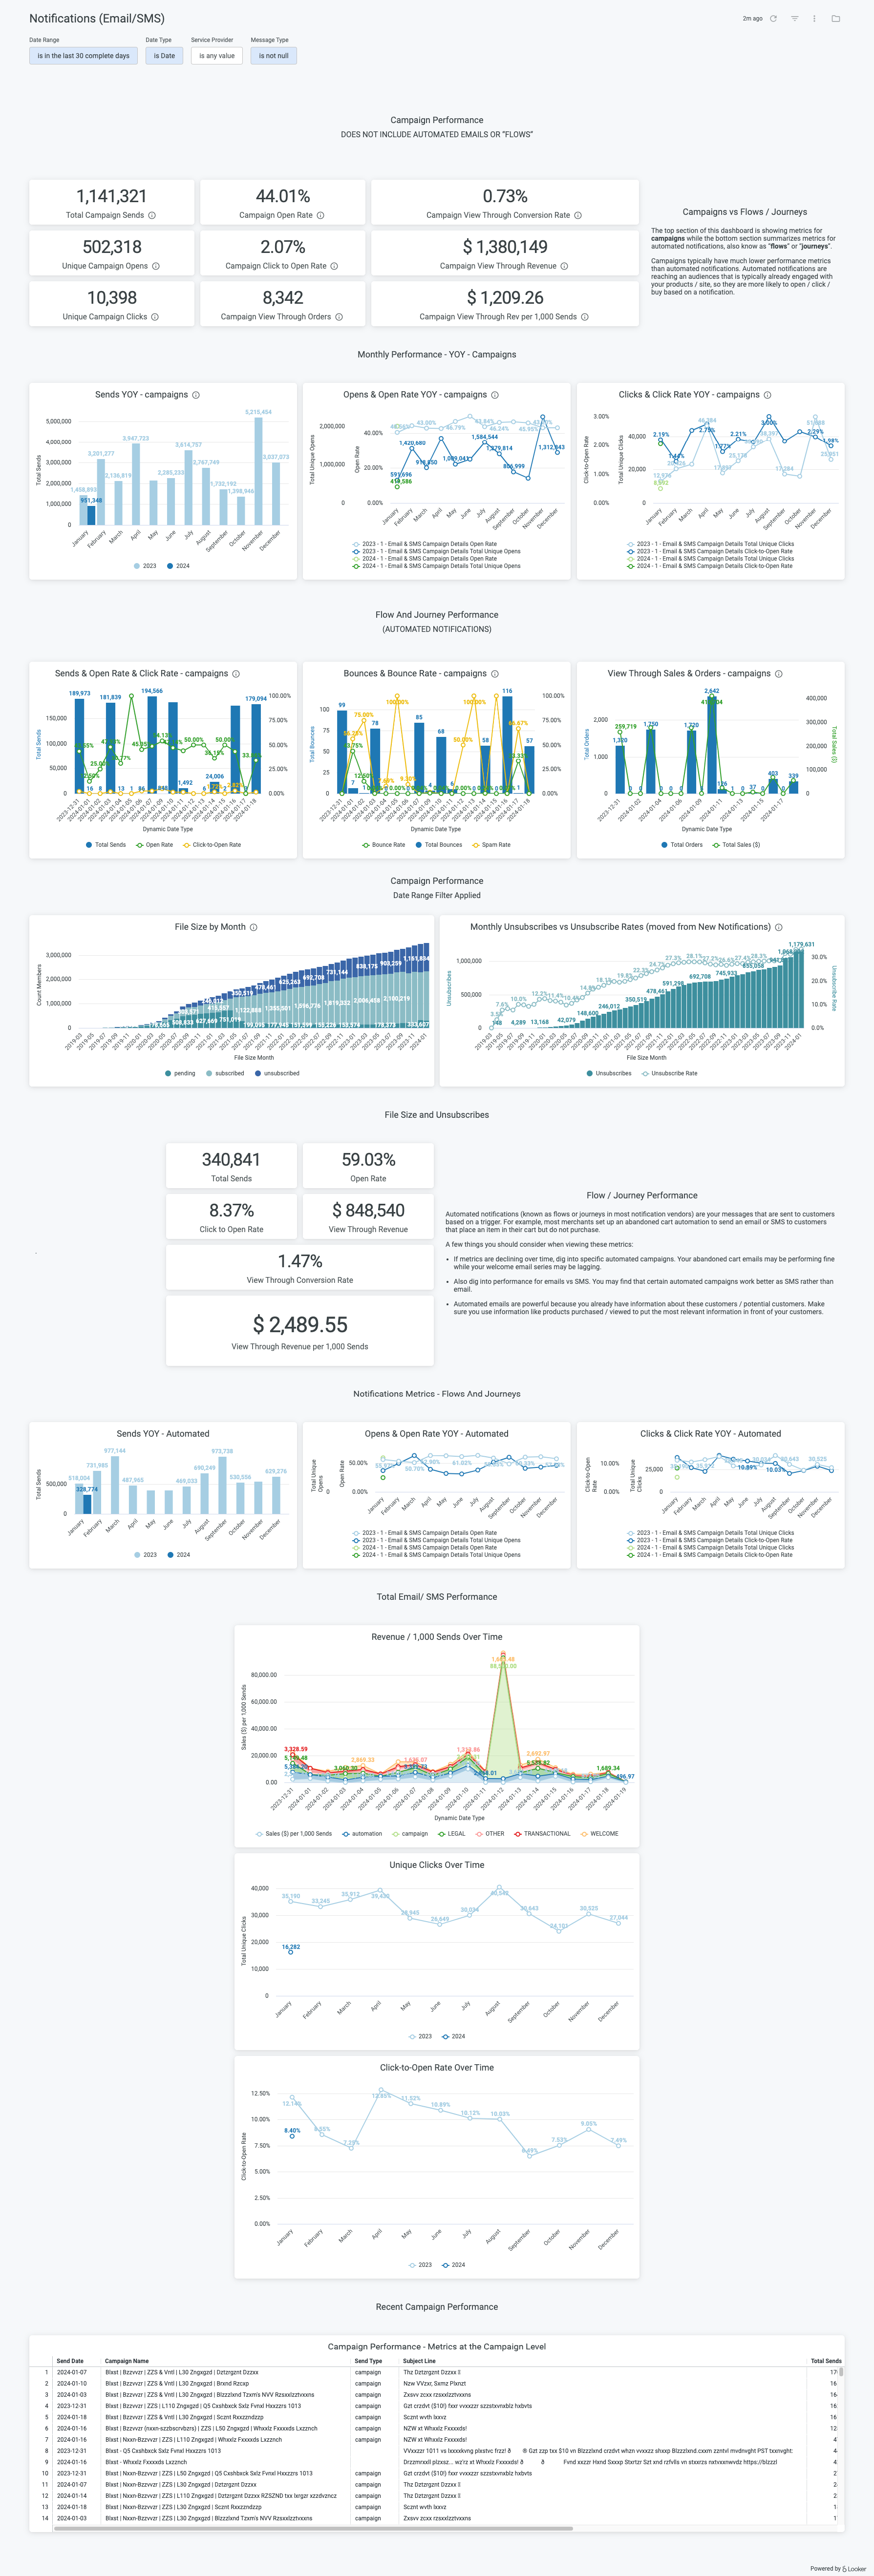
The rise of SMS as a marketing vehicle has completely changed how merchants interact with their customers. The Notifications dashboard is designed to give merchants a view into Email and SMS performance at both an aggregated level and individually, with data broken up between standard campaigns and automated notifications.
Here are the key sections of this dashboard:
Campaign Performance — The first section of this dashboard contains standard notification metrics for campaigns (automated notifications are filtered out). Note that you can filter these metrics using the filters at the top of the dashboard to select a different date range, service provider (e.g., Klaviyo), or message type (Email vs SMS).
Monthly Performance - YOY - Campaigns — The next section focuses on send, open rate, and click rate comparisons for the last 2 years for campaigns only (no automated Journeys or Flows). This allows you to see a YoY comparison for these metrics to ensure that these metrics are remaining consistent or improving. Note that the message type and service provider filters will impact this section, but the date range and date type filters will not.
Campaign Performance — The next sections shows sends, open rates, click rates, bounce rates, and view through sales and orders for campaigns only (no automated Journeys or Flows). The date range filter and date type filter will both impact this section, so if you want to see this data for the last 365 days by month you can use those to change the visualizations.
File Size and Unsubscribes — The next sections shows sends, open rates, click rates, bounce rates, and view through sales and orders for campaigns only (no automated Journeys or Flows). The date range filter and date type filter will both impact this section, so if you want to see this data for the last 365 days by month you can use those to change the visualizations.
Flow and Journey Performance — The next section of this dashboard contains many of the same standard notification metrics from the first section but for automated notifications only. Once again you can filter these metrics using the filters at the top of the dashboard to select a different date range, service provider (e.g., Attentive), or message type (Email vs SMS).
Total Email/SMS Performance — This sections shows combined data for automated and campaign notifications over time, with Email and SMS combined. Every dashboard filter will impact these visualizations if you want to see data for a specific provider or by week or month.
Recent Campaing Performance — Finally, this last section shows performance for specific campaigns that have been sent in the date range selected in the dashboard. Note that sales and orders are "view through" data as defined above. You can use this final visualization to look for issues with specific notifications sent, whether it's a campaign or an automated notification. Look for specific campaigns with low click or bounce rates.

Setup
This dashboard will be available by default, but you'll need at least one Email/SMS integration set up in Daasity for it to be useful.
Important notes
"View Through Orders" and "View Through Revenue" are defined by Daasity as orders and revenue coming from customers within 5 days of receiving an email or SMS.
Was this helpful?