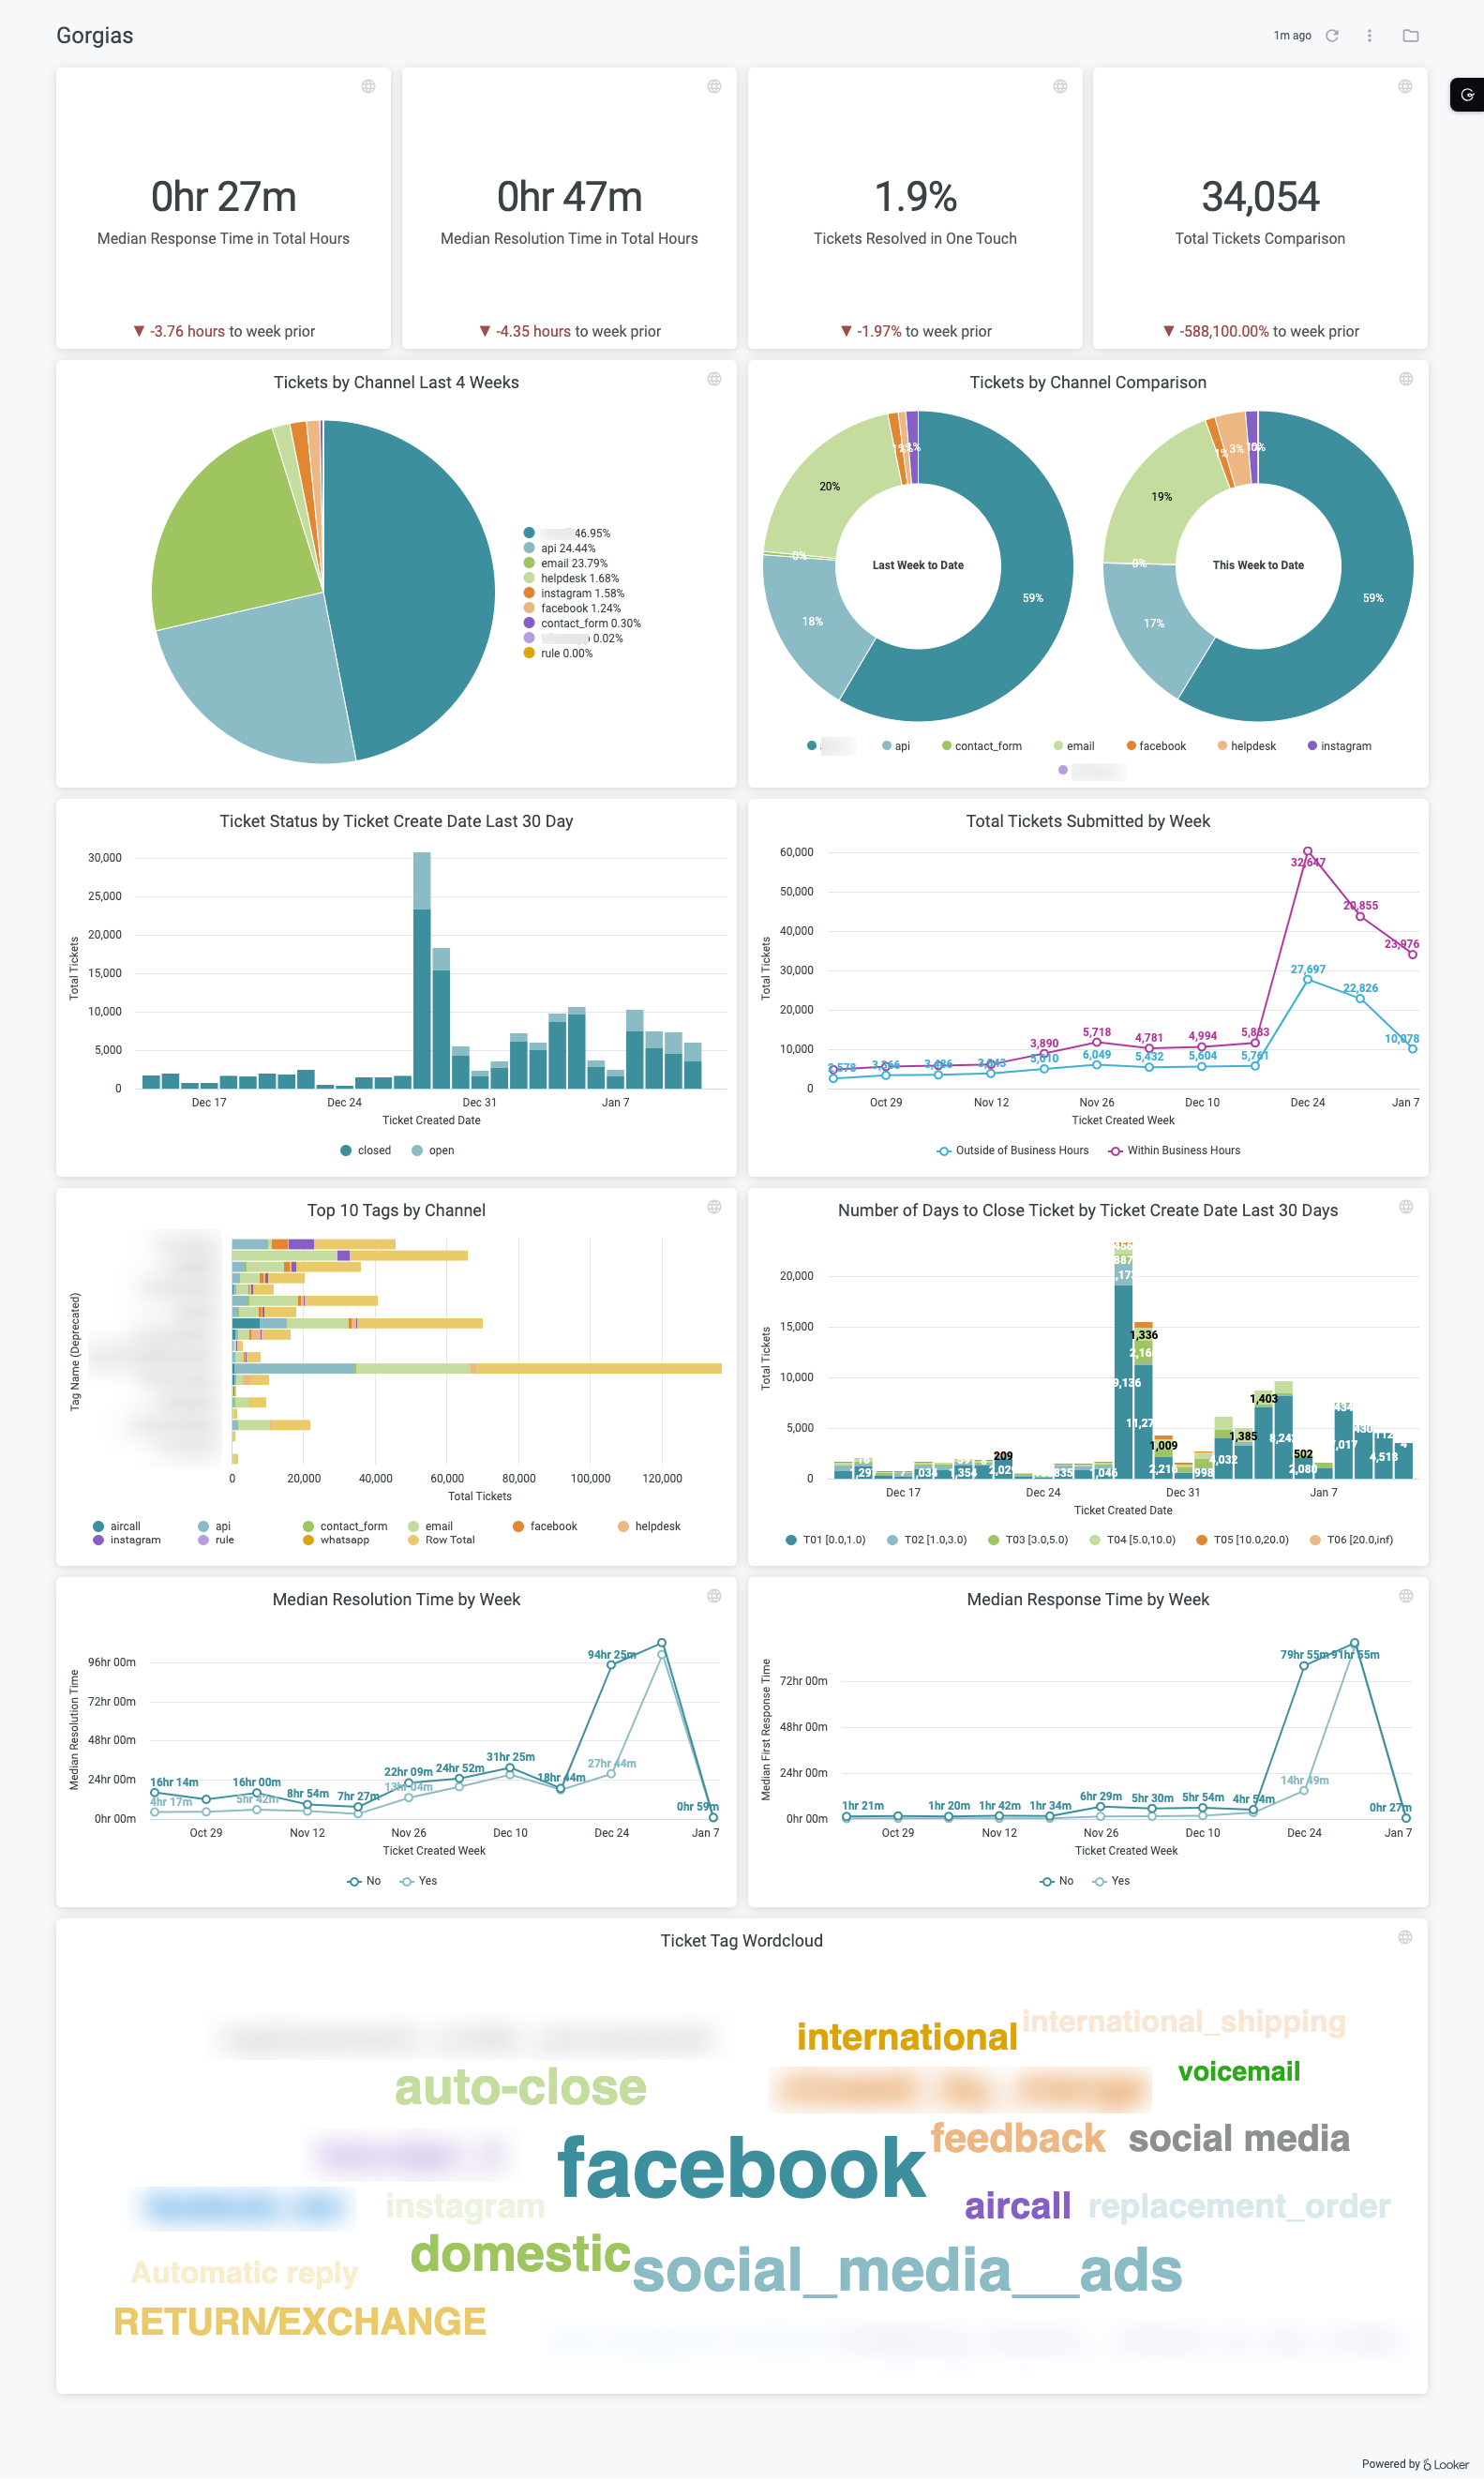
Gorgias
Overview
The Gorgias Dashboard was created to help merchants with a Gorgias integration understand how their customer service departments are performing, with the goal of creating the best possible customer experience. With this dashboard merchants should be able to answer the following questions:
Are there any customer support tickets that have been outstanding for a long time and need immediate attention?
Is my average response and ticket close time trending up or down?
Is there a common theme among my support tickets? For example, if a specific product is repeatedly mentioned or if you see keywords like "broken" or "poor quality", you may need to investigate if you have product quality issues.

Setup
Growth accounts
If you have a Growth account, you just need to set up the Gorgias integration and trigger a history load. Once you do this, you will see the Gorgias dashboard in your dashboard list.
Enterprise accounts
If you have an Enterprise account, please reach out to [email protected] to help you set up the explore and dashboard. Or, if you have developer access in Looker, you can simply add the following line of code to your addons.lkml file:
Once enabled, just search for "Gorgias" using the search bar in Looker.
Data sources
All of the visualizations in this dashboard come from our Gorgias explore.
Important things to know
Please see our Important Notes article for the Gorgias integration to understand why our data may not exactly match what you see in the Gorgias user interface.
Was this helpful?