Marketing
Overview
The Marketing Dashboard aggregates data from various sources to give you a comprehensive overview of your marketing performance.
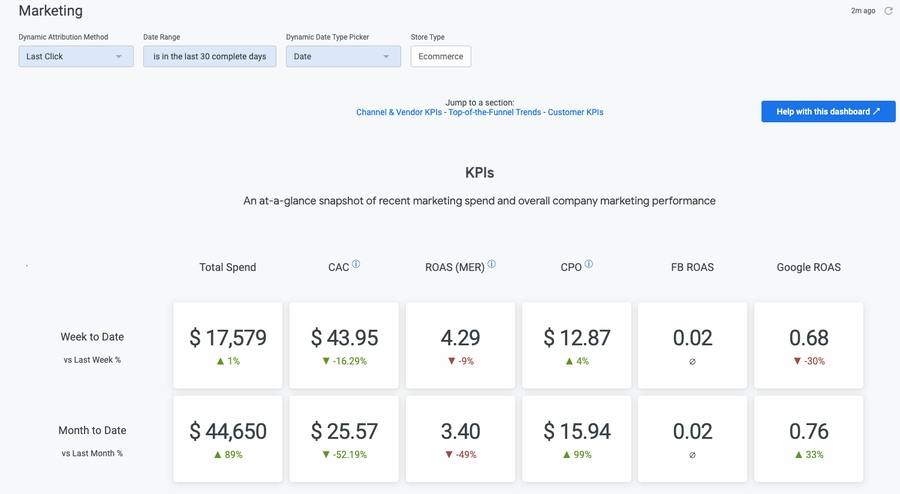
KPIs — Get an at-a-glance snapshot of recent marketing spend and overall company marketing performance.
Channel & Vendor KPIs — Drill into how individual marketing channels and vendors are performing.
Attribution Comparison — Analyze how performance varies when comparing different attribution models. To get even more detailed, pop open the Attribution Deep Dive dashboard.
Top-of-the-Funnel Trends — Understand how often your ads are being shown & how many potential customers are clicking on your ads. This section shows only vendor-reported data.
Customer KPIs — Understand how a customer's first marketing interactions with your brand affect long-term customer performance metrics like Lifetime Value and Repurchase Rate. Get insights into how many customers each channel is acquiring and whether a marketing channel is more likely to generate first-time orders or recurring orders.
Set up your Google Analytics 4 via BigQuery integration to get the full value of this dashboard
In order for us to give you Last Marketing Click, Last Ad Click, and Assisted attribution models, you must first set up your Google Analytics 4 via BigQuery integration. Google Analytics does not make this information available anymore through its API, so we use the raw data contained in the BigQuery export to deliver these attribution models.

Setup
The Marketing dashboard will be available in your dashboard list by default.
Data sources
The KPIs, Channel & Vendor KPIs, and Attribution Comparison sections use the Marketing Attribution explore. This explore reflects data from your Google Analytics and marketing integrations.
The Top-of-the-Funnel Trends section uses the Vendor-Reported Marketing Performance explore, which contains vendor-reported data from your marketing integrations.
The Customer KPIs section includes tiles using the Lifetime Value and Order Line Revenue explores.
Important things to know
If the channel and vendor values are not reflecting data in the ways you would expect them to, please refer to our articles on Channel Mapping.
Was this helpful?
