Loop Returns
Overview
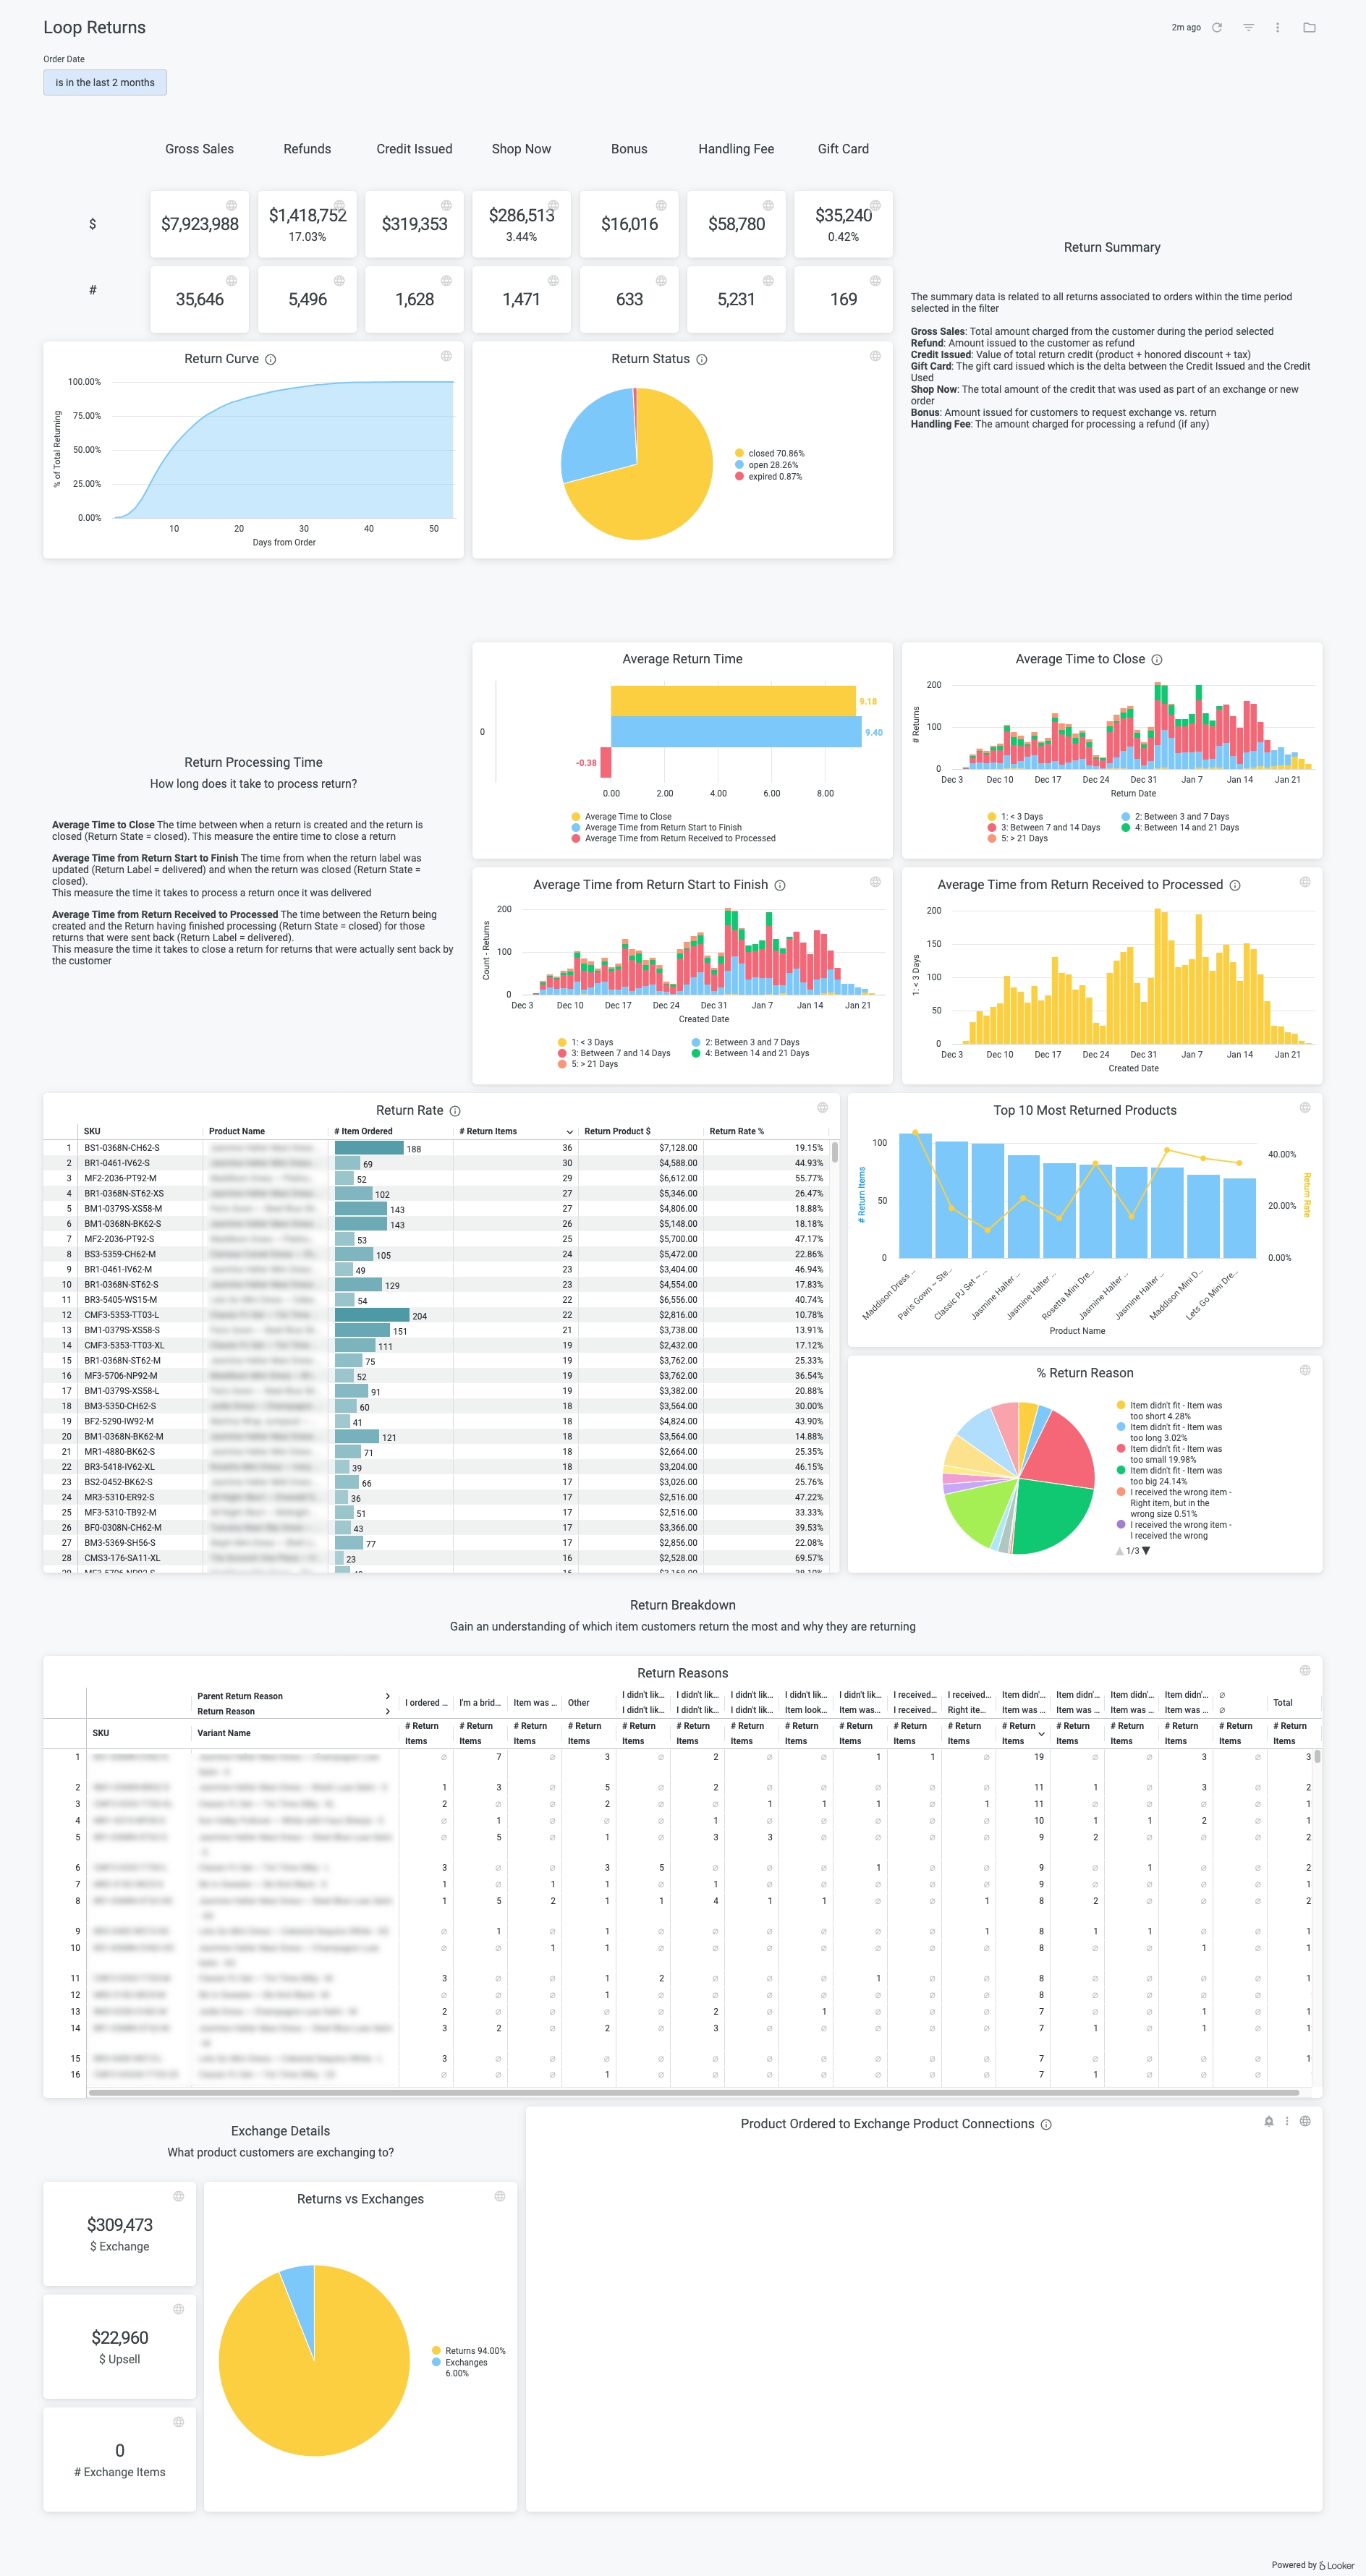
Loop Returns is a Shopify platform that enables merchants to simplify the returns process and encourage customers to turn returns into exchanges by offering 4 ways to return: exchange, shop now, store credit or refund. Loop Returns manages the exchange / return process, leading to a higher rate of exchanges and quicker cycle times to get returned inventory back in your warehouse.
With proper analysis, this dashboard can help answer the following questions:
Which products are being returned or exchanged at a high rate? Why are they returning or exchanging these products and could this indicate a quality issue?
How long is it taking to process a return and receive the returned item?
What product are customers exchanging into? Is it the same SKU in a different size or a completely different SKU?
Return Summary — This section displays all of your top-level metrics in both dollar-amount and order numbers, that are important for the Loop integration.
Return Processing Time — This section has several views around the time it takes to receive and process returns. There are multiple measurements in return time. There is time from Open to Close, Time from Receipt to fully Processed. This will help you identify where there are areas for improvement, or where issues may be occurring, or conversely, improvements and optimizations taking effect.
Product-Level Return Detail — This final section has detail around your product assortment and returns. We've mapped the return back to the original order so that we can perform analysis on product-level return rate.

Data sources
All of the tiles in this dashboard use the Loop Returns explore, which primarily contains data from Loop Returns, but also includes sales data from Shopify.
Setup
Important notes
Metric definitions
Gross Sales: the total amount charged to a customer less tax.
Refund Amount: the total amount that has been refunded to customers.
Credit Issued: the total amount of store credit that has been issued in lieu of refunds.
Shop Now: the total amount from the refund that was used to exchange.
Bonus: the total amount issued to customers who request an exchange rather than return.
Handling Fees: if applicable.
Gift Card: the delta outstanding between the credit issued and the credit used.
Below your summary metrics, you'll find a Return Curve and Status.
The Return Curve shows the average percent of orders returned over a period of time. This is helpful in forecasting to understand at what point, on average, you will have likely issued all returns and the velocity that they happen. This can be used to help scale up customer support by predicting when your return volume will be heaviest after large sales days.
The Return Status shows the current state of returns and if they are Open or Closed.
Was this helpful?