Exporting Data
This page discusses how to download the data or visualization from a Look or from the Explore page in a variety of formats.

File Formats
Data can be downloaded in the following formats.
For dashboards:
PDF
CSV
For Looks, Explores:
TXT (tab-separated values)
Excel Spreadsheet (Excel 2007 or later)
CSV
JSON
HTML
MARKDOWN
PNG (Image of Visualization)
Results
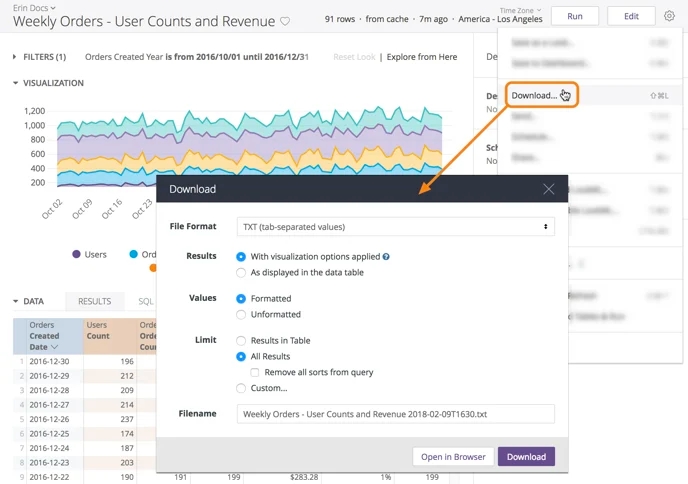
In the Results section, choose whether you want visualization settings applied to your data download:
If you choose With visualization options applied, Looker applies some of the visualization settings to your download, causing your download to appear similar to a table chart. Any of the following settings in the Plot, Series, and Formatting menus that are configured for the visualization will be applied to the data download:
Show Row Numbers toggles whether to show a row number at the beginning of each table row.
Hide Totals - If your Explore includes column totals, Hide Totals toggles whether to show the totals in the visualization.
Hide Row Totals - If your Explore includes row totals, Hide Row Totals toggles whether to show the row totals in the visualization.
Limit Displayed Rows to a maximum of 500 rows shown or hidden.
Show Full Field Name toggles whether to show the view name along with the field name for each column header. When Show Full Field Name is off, generally only the field name shows; however, measures of type count display only the view name instead.
Custom labels for each column (note that JSON files will always use raw field names, not the field label).
Conditional Formatting for downloads of table chart visualizations in Excel format.
If you choose As displayed in the data table, visualization options will not be applied, and the download will appear like the data table in the Data section of the Look or Explore.
Values
In the Values section, choose how you want the downloaded query results to appear:
If you choose Unformatted, Looker does not apply any special formatting of your query results, such as rounding long numbers or adding special characters your Looker developers may have put in place. This is often preferred when data is being fed into another tool for processing.
If you choose Formatted the data will appear more similar to the Explore experience in Looker, although some features (such as linking) aren’t supported by all file types.
Limits
You can choose how much data you want to download as follows:
Results in table: Number of rows specified by the row limit of your Look.
All Results: All results returned by the query. Before selecting this option, see the All Results section below.
Custom: A custom number of rows. Users with download with limit permissions are limited to 5,000 rows. The limit for other users is typically 100,000 unless your admin has increased that limit.
All Results
When you click Run in a Look or an Explore, Looker checks your permissions and determines whether the complexity of the query and the database dialect will allow the entire query to be downloaded. If you have the permissions (for results above a set limit) and if Looker determines that your entire query can be downloaded, the All Results option will be available in the Download window.
The option to download All Results may be unavailable under certain conditions:
The All Results option is typically disabled for queries that:
Involve row totals or table calculations.
Use percent of total, percent of previous, or running totals types of measures.
Retrieve data from a database dialect that cannot stream results.
Include pivoted columns that Looker calculates because the data comes from a database dialect that cannot calculate the pivots.
Even when the All Results option is available, you should still use caution when downloading all results. Some queries are very large, containing thousands or millions of rows, which can overwhelm most spreadsheet programs — or even your instance.
If the All Results option is unavailable, which may be the case depending on your permissions, you can instead use the Custom option to specify the maximum number of rows allowed with your permissions.
Download or Open in Browser
Once you’ve selected your options, you can click the Download button to download a file to your computer, or click Open in Browser to view the file in the browser.
Expand Tables
To display all rows of a data table — rather than just those rows that display in the dashboard tile thumbnail — in a PDF dashboard delivery or download, check the Expand tables box.
Paper Size
You have the option to specify the optimal size and orientation of dashboard PDFs by selecting from the Paper size drop-down menu. Large visualizations or groups of overlapping dashboard tiles may need to be resized to fit cleanly on a PDF page.
Inspired by Looker's original article.
Was this helpful?