Validating GA4 Data in Daasity
Important things to know when working with Google Analytics 4 data extracted via the API
Reporting delays
The time it takes for data to be available in reporting is much longer for GA4 than it was for Universal Analytics.
The delay will vary based on the size of your business. In some cases, we are seeing ecommerce data unavailable until 10 a.m. the next morning 😱.
Since most daily workflows kick off at around midnight, this means your GA4 data for the previous day may only contain partial data — or may be missing entirely.
If you are a Growth merchant, unfortunately there is not much we can do to mitigate this delay.
Discrepancies with the GA4 reporting interface
It is expected that the session counts you see in Daasity reporting will not exactly match what you see in the GA4 user interface. However, other metrics like transactions should match exactly.
There are two main reasons for discrepancies in session numbers in your Daasity reporting vs. the GA4 reporting UI:
GA4 sessions are estimates — not exact counts. This is likely the cause of the discrepancy if your Daasity session counts are just a few percentage points off from your GA4 reports.
Cardinality limits sometimes create an "(other)" row in API results that inflates session counts. This may be the cause of the discrepancy if your session counts are inflated by 100% or more.
GA4 sessions are estimates — not exact counts
When comparing daily session totals in Daasity vs the GA4 reporting interface, you'll notice the numbers do not match exactly. Typically, they will be within 5% of each other.
The reason for this discrepancy stems from Google using session estimations in GA4 reporting rather than doing exact session counts. That means any time you see a session count in the GA4 reporting interface or Data API, the number is not exact.

You will get slightly different session estimations depending on the combination of dimensions you're using for your analysis. This can lead to some oddities in reporting. Take the following report from the GA4 reporting interface, for example. The session estimation for the overall 10-day period (544,359) is 4% higher than the sum of session estimations in each row (522,110):

In your daily GA4 data extraction, we are segmenting your data on a number of levels to get you data on user types, traffic attribution, and user location.
This means that when you sum up the session counts that we pull out of the API for you, they will differ from the unsegmented daily totals that you will see in the GA4 reporting interface. Unfortunately, this is expected due to the fact that all session counts in GA4 reporting are just estimations, and there is no way around this while using the GA4 API for your reporting.
The "(other)" row
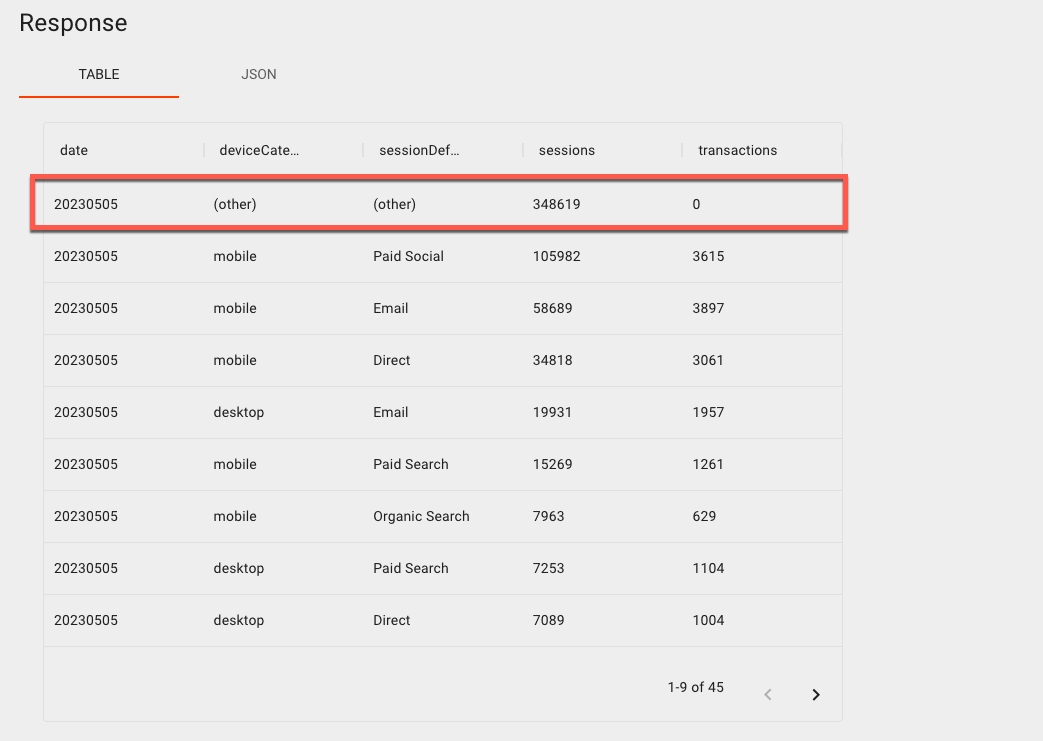
When a report that is pulled from the GA4 Data API has a large amount of data, it will group less common values into an "(other)" row:

You can learn more about what the "(other)" row is and why it shows up in reporting by reading Google's documentation on the subject.
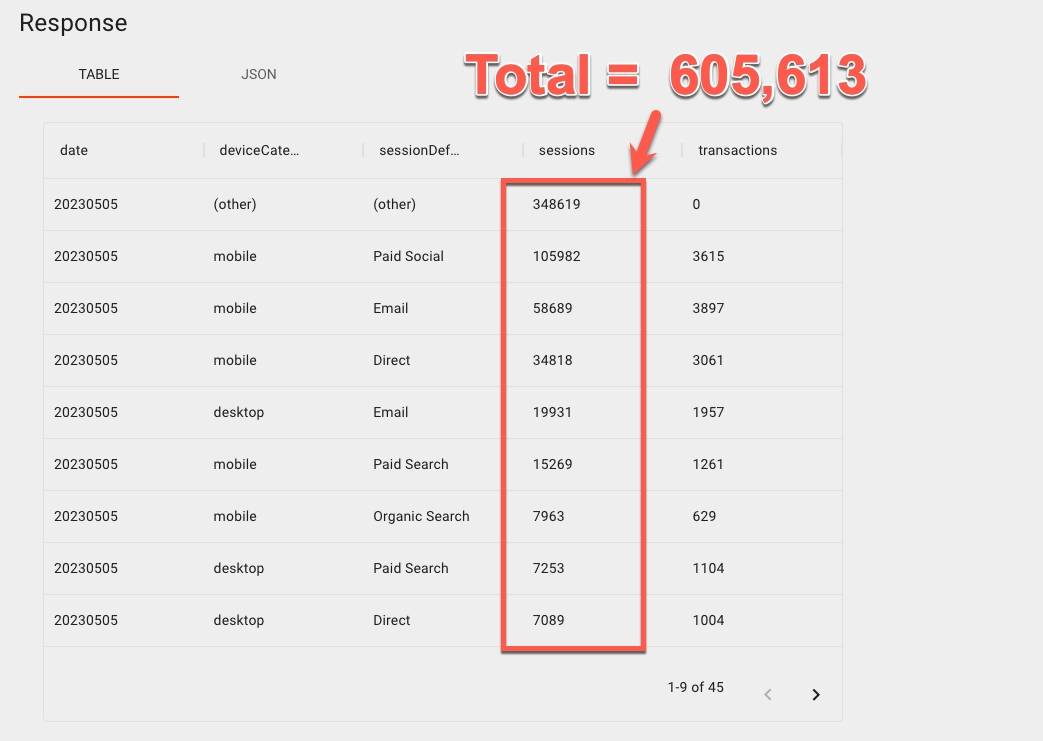
The impact to your reporting is that it can drastically inflate your session counts.
For example, the following two screenshots are for the same account for the same day. But when adding dimensions that introduce the "(other)" row, the sum of the session counts is thrown out of whack:


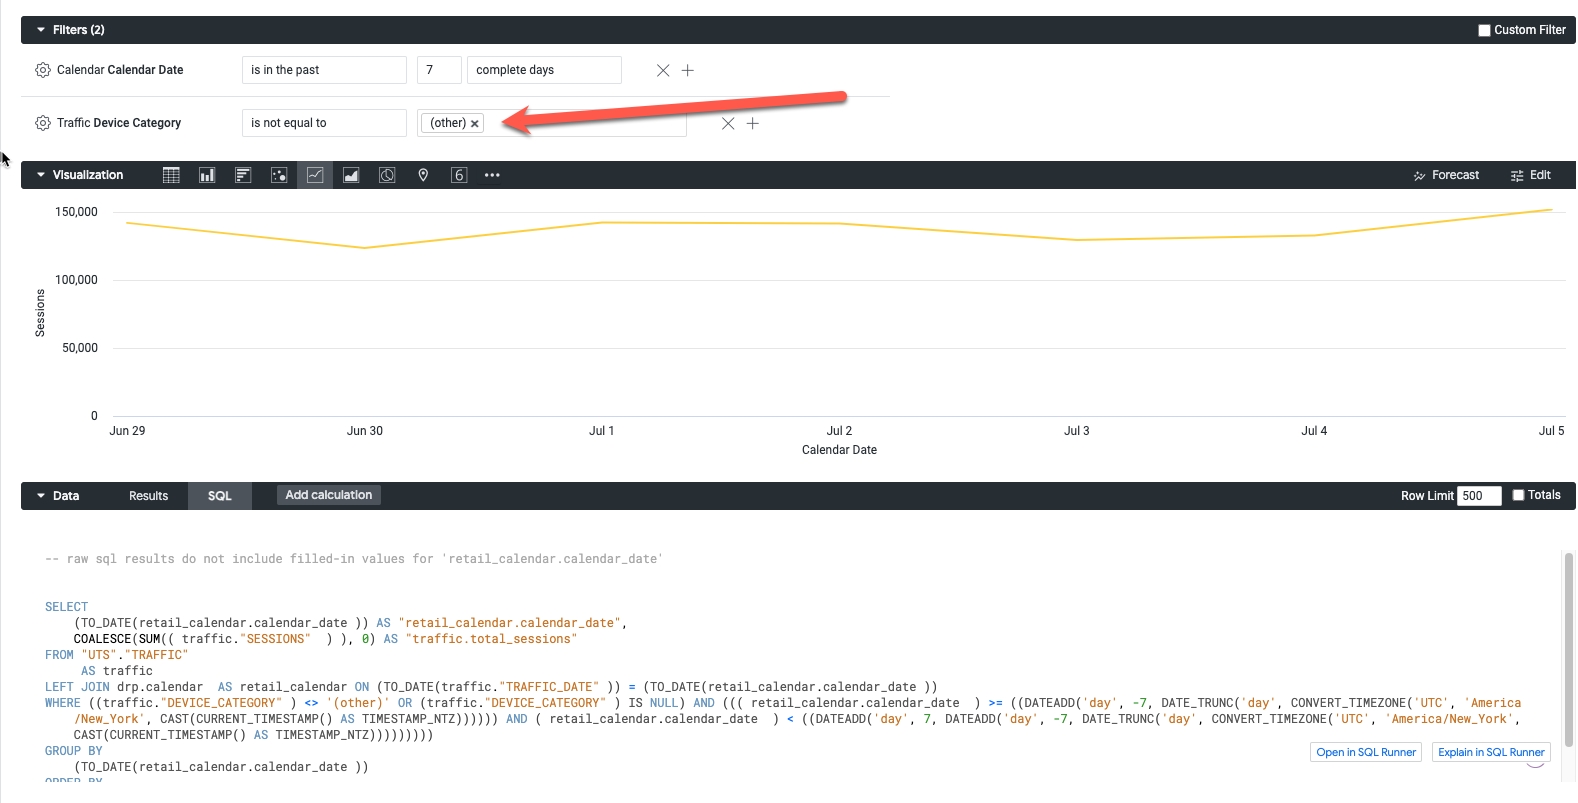
If the "(other)" row is causing issues with a report, you can modify the Looker report or query to simply filter out rows where device category = (other), like in this example:

Alternatively, if you want to always exclude "(other)" from your UTS explores in Looker, you could add an always_filter parameter to each explore like in this example:

Doing so will automatically apply the filter to the explore, but still allow users to change or remove the filter:

Spike in traffic with 'UNKNOWN' or 'Missing from BSD' channel
Our channel and vendor dimensions are derived from raw GA4 traffic attribution info and the channel-mapping rules in your BSD.
If you don't make any updates to your channel-mapping BSD, you will likely see a spike in the amount of traffic with a channel value of "UNKNOWN" or "Missing from BSD".
This is because many of the default channel-mapping rules use the Google Analytics Default Channel Grouping as an input, and Google has changed those default grouping rules in the transition from Universal Analytics to GA4. They have added new default values and have phased others out.
For example, in Universal Analytics, all traffic that didn't fall into a pre-defined default channel grouping was assigned a value of "(unavailable)" or "(other)". But in GA4, that traffic is now assigned a default channel grouping value of "Unassigned". Since Unassigned was only introduced, you likely don't have a channel-mapping rule set up to apply to that traffic, and you will need to add a new rule for it.
To quickly cut down on the amount of "UNKNOWN" or "Missing from BSD" traffic, you can add some catch-all rules to the bottom of your channel-mapping BSD that will group the new values introduced in GA4. Here are the steps to do so:
Add the following entries to the Channels column of the configuration tab:
Cross-network
Paid Video
Audio
Mobile Push Notifications
Organic Shopping
Paid Other
Organic Video
Add these rules below the other existing rules in the Channel-Mapping BSD: https://docs.google.com/spreadsheets/d/18nB-DlZseDIrv8SYbyxKUCPllQzIGTDCeP2zIR5DMkA/edit?usp=sharing
Requesting an attribution reset via support. If you don't do this, the new rules will only apply to new data.
Traffic attribution dimensions
Why we use session-scoped dimensions
Universal Analytics had only a single set of traffic attribution dimensions, but GA4 has three. For example, whereas Universal Analytics had a single Source / Medium dimension, GA4 has:
Source / medium - This is event-scoped and uses the attribution model specified in your GA4 property (the default model is data-driven attribution).
Session source / medium - This is session-scoped and represents the source / medium that initiated the session.
First user source / medium - This is user-scoped and represents the Session source / medium for the user's very first session.
Our reporting uses the session-scoped values. So if you're comparing what Daasity is reporting for Source / Medium vs what you're seeing in your GA4 reporting, you should compare the Daasity values with your GA4's Session source / medium value.
There are two reasons we use the session-scoped values by default:
Problems caused by Data-Driven Attribution — Most merchants will leave their conversion attribution settings to the default Data-Driven model. In this model, a transaction can be attributed to more than one source / medium. For example, for a $100 order, GA4's DDA model might give 60% of the credit to google / organic and 40% of the credit to google / cpc. In this situation, you will have two different source / medium values for a single transaction. Our base data models require a transaction to only have a single set of attribution dimensions, which makes it incompatible with the DDA data. This is why we use session-scoped dimensions in our base data models, since each purchase will only have a single session-scoped attribution dimension.
Incorrect session counts — Another problem with event-scoped attribution dimensions is they will not give you correct session counts, so we cannot use them for your traffic data.
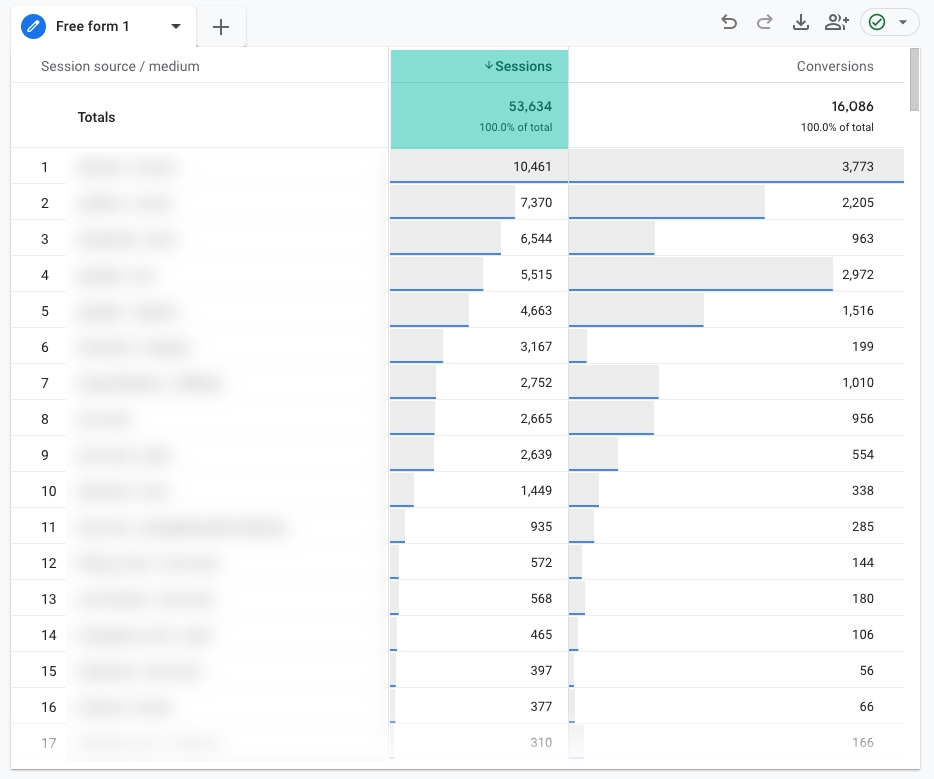
For example, when you look at this report segmented by Session source / medium, the session total for the day is 53,634, which matches other reports in this merchant's GA4:

But when you segment by the event-scoped Source / medium, the report shows only about 10% of the true session total — even though the conversion numbers are still the same:

(not set) traffic attribution
Many merchants have experienced an issue with seeing a value of "(not set)" for their session source, session medium, session campaign, and session default channel grouping dimensions.
According to Google's documentation, this comes down to a tracking issue. With GA4, you must send a session ID with each hit that ties to an existing session_start event:

If the hit (e.g.: recording a purchase) sent to GA4 does not have a valid session ID, then GA4 cannot tie the hit to an existing session, and it will return "(not set)" for session-scoped dimensions.
This problem typically is larger when you are using a server-side tracking solution that does not pass a session ID for offline hits.
Unfortunately, there is not much Daasity can do to mitigate this issue because ultimately it comes down to a tracking problem.
Changes to item-level ecommerce metrics
Google Analytics has always made item-level ecommerce metrics available. These metrics allow you to see how often a particular item was viewed, added to cart, purchased, etc.
However, these metrics have fundamentally changed in the shift from Universal Analytics to Google Analytics 4.
When you look at item adds to cart for a particular product in Universal Analytics, for example, the metric was indicating how many times the product was added to cart.
But in GA4, this metric is indicating how many units were added to cart.
So if a customer added 4 units of Product A to cart on your website, the "adds to cart" metric would be 1 in Universal Analytics (the number of times this user added Product A to cart), but it will be 4 in GA4 (the units of Product A that were added to cart).
This has serious implications for calculating rates such as add-to-cart rate, which is typically calculated as product adds to cart divided by product detail views. You may run into scenarios where add-to-cart rates (or other shopping-funnel rates) are near or over 100%. For example, if a customer views a product once and adds 4 units to cart, their add-to-cart rate will appear to be 400%.
Unfortunately, Google has not announced plans to release item-level metrics that work the same as the old Universal Analytics metrics.
Partially processed data
Unlike Universal Analytics, GA4 makes partially processed data available in the Data API. Partially processed data will have blank values for some dimensions, which are populated later. This usually affects session attribution and device-specific dimensions.
Typically, all of the data is fully processed and populated within 2 days.
Since we are using some of these dimensions as part of the sync key, we are quarantining traffic data from the past 2 days (relative to the day the data was pulled) in a separate table: ga4_api.base_traffic_partial. The contents of this table are deleted each day prior to loading new data.
That means the main traffic table — ga4_api.base_traffic — does not contain data for the previous two days.
Any custom analysis you do directly on your extractor tables will need to take this into account.
Was this helpful?