Product Repurchase Rate
Overview
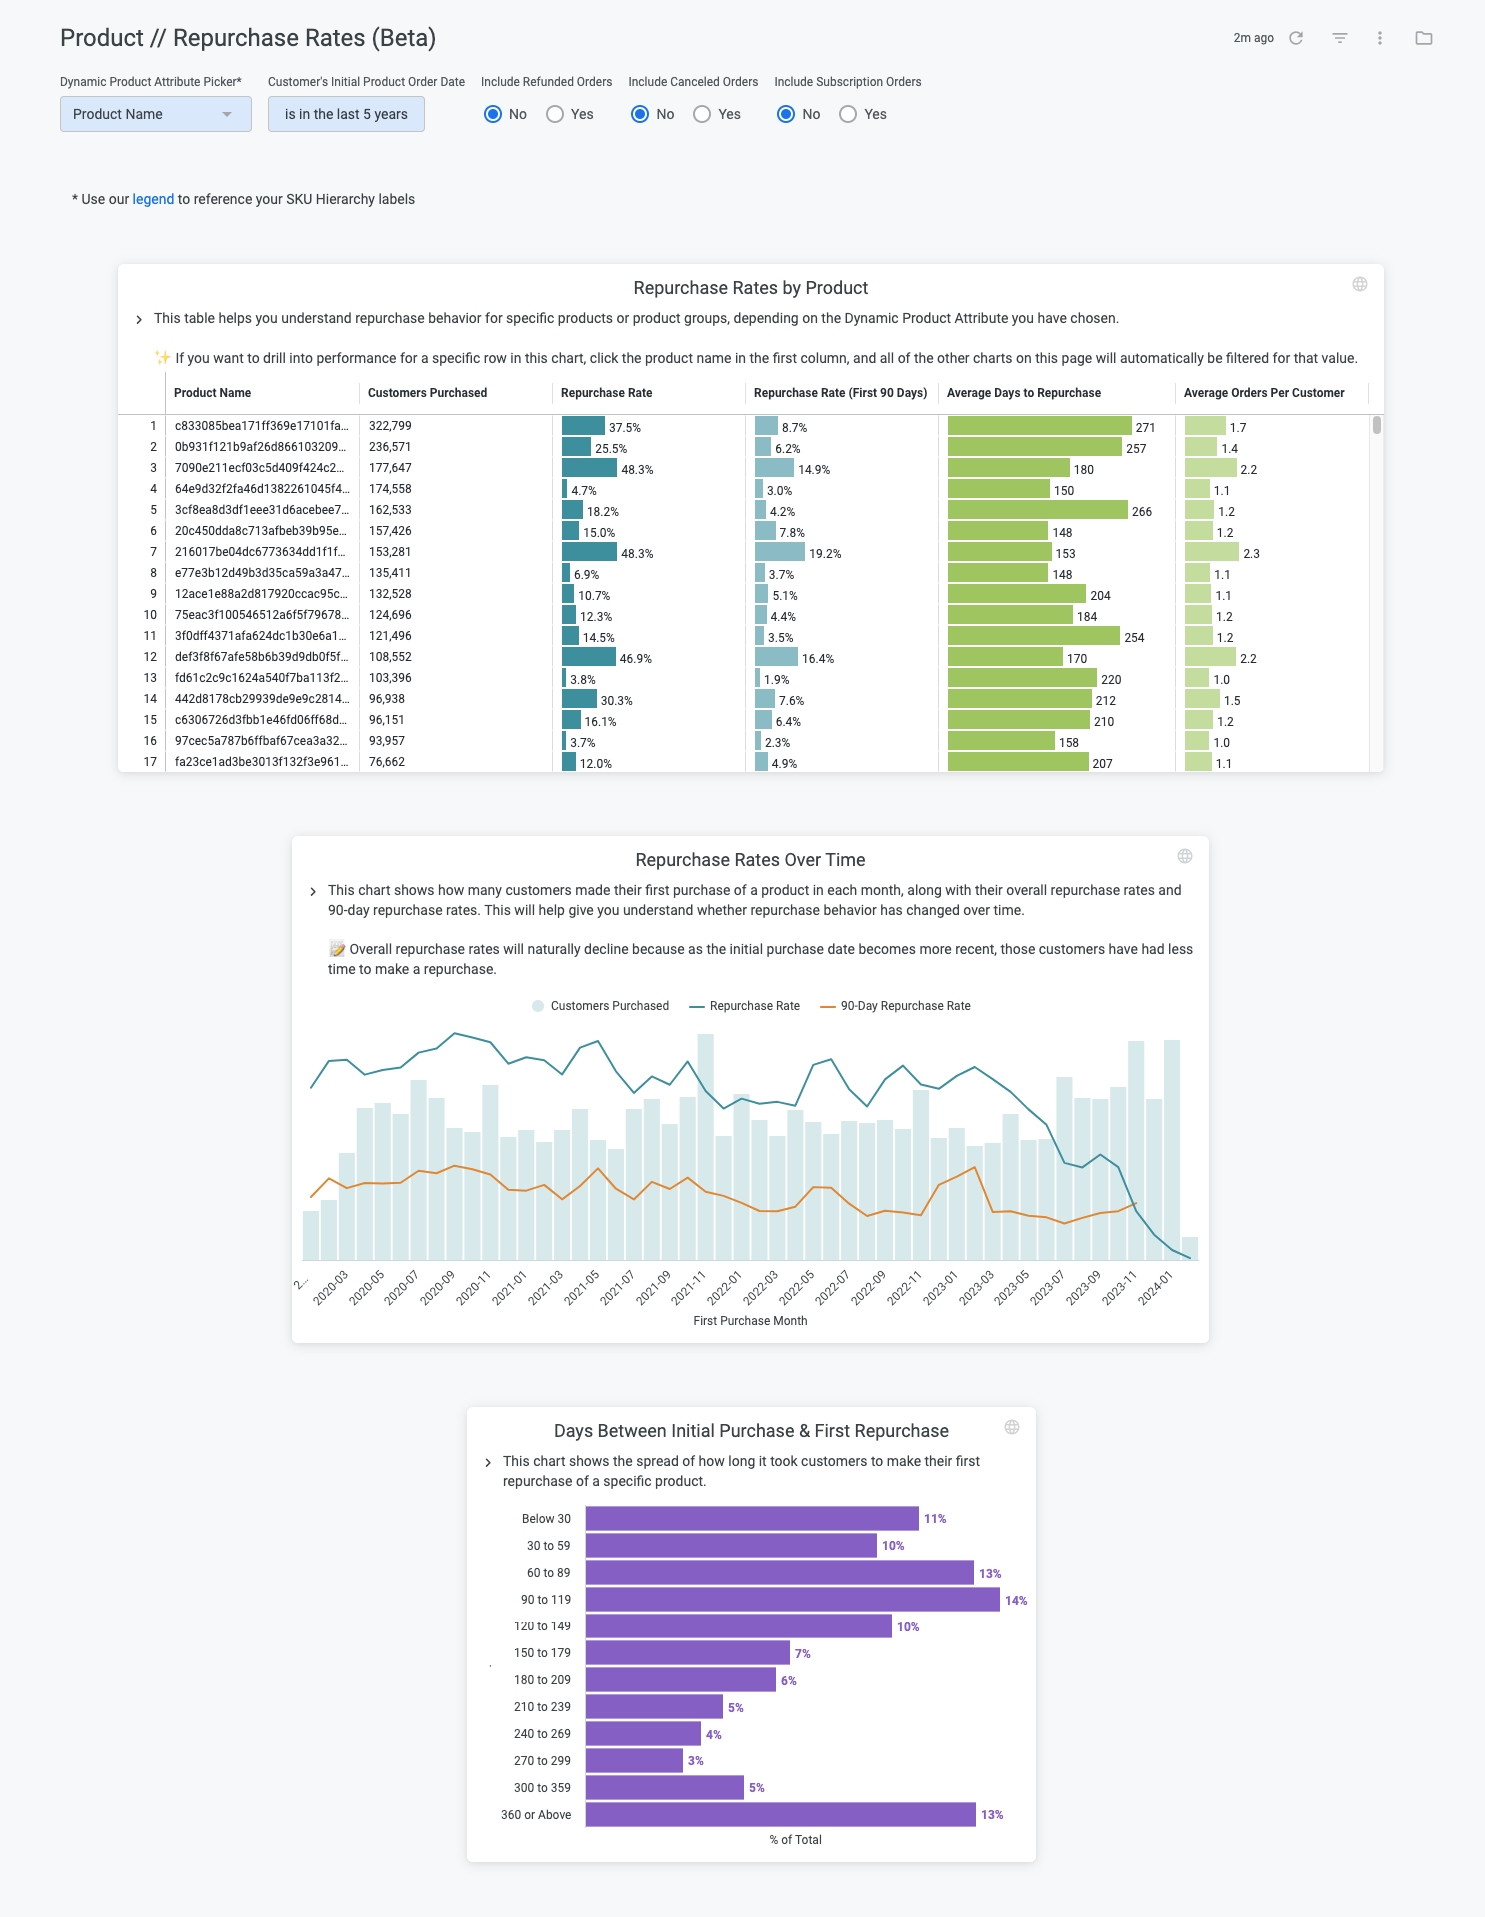
The Product Repurchase Rate (Beta) dashboard helps you understand repurchasing behavior across your product line.
Some of the questions you can answer with this dashboard include:
What products have the highest and lowest repurchase rates?
Have a particular products repurchase rates increased or decreased over time?
Among repurchasers, what is the average amount of days elapsed before repurchase?

Setup
Tips for using this dashboard
Analyze repurchase rates across different product dimensions
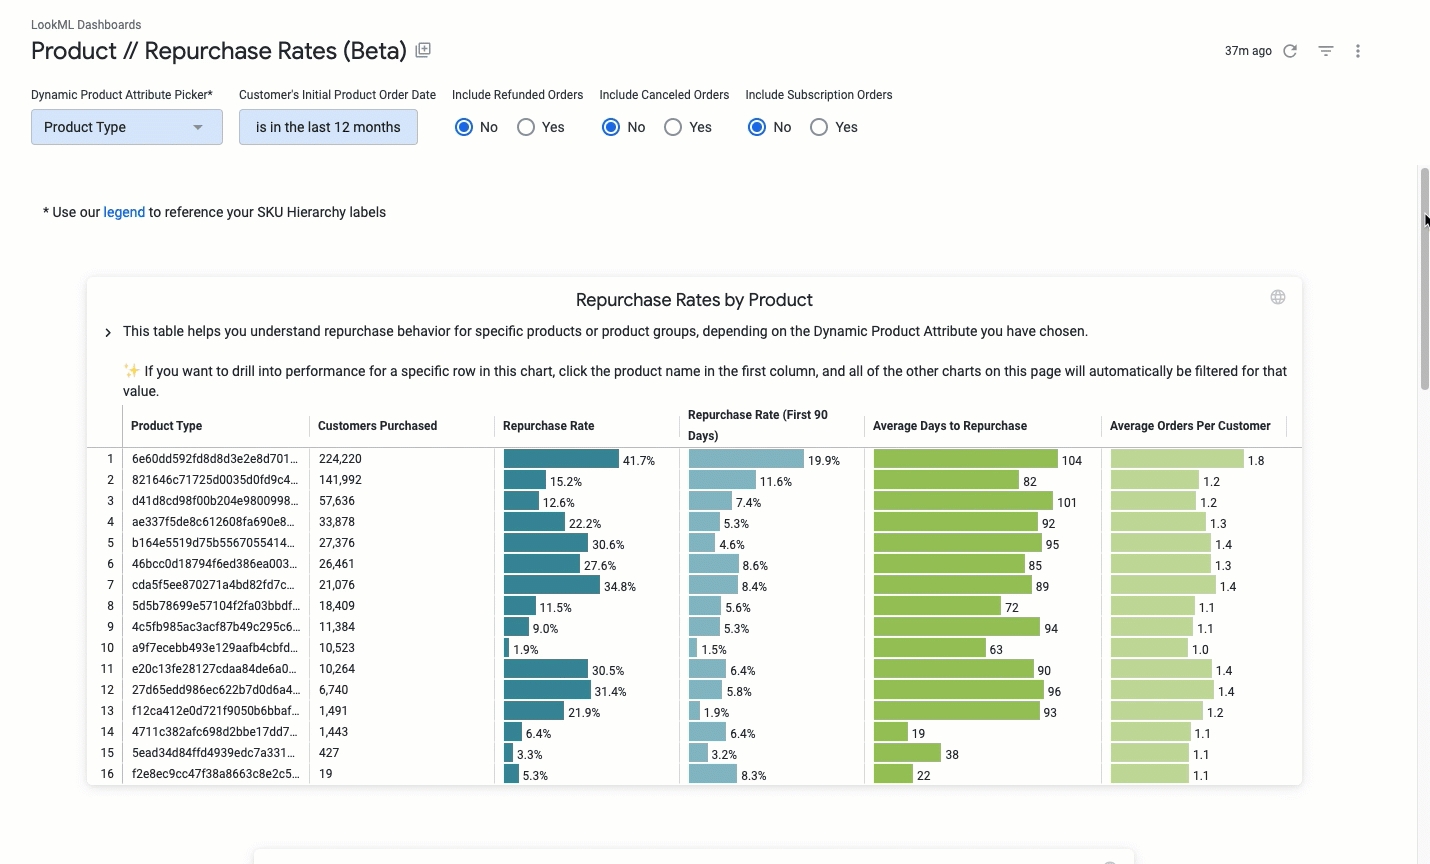
You can analyze repurchase rates by Product Name, Variant Name, SKU, Product Type, or any dimension from your Product Hierarchy BSD. Use the Dynamic Product Attribute Picker to change the level of analysis:

When segmenting repurchase rates by Product Type, for example, the repurchase rates indicate what percentage of customers who purchased a product under that product type purchased the same product or another product of the same type.
Use cross-filtering to supercharge your analysis
This dashboard has cross-filtering enabled, which means you can click on any value in a visualization to filter the rest of that dashboard for results that match that value. This makes it easy to drill down to see details for a specific product or product group.

How the date filters work
The dashboard by default is set to use the following default filter:

This means the dashboard is only showing repurchase data if the customer's initial purchase of the product was in the past 5 years.
Dashboard loading speed
The explore that powers this dashboard uses derived tables to make your analysis as flexible as possible. The flexibility is great, but it also means that the dashboard has to rebuild the database table every time a filter changes. The result is the dashboard may load a bit slower than the typical dashboard.
If you use this dashboard or explore frequently and want to speed up performance, you can create custom transformation code that mimics the derived table. If you add this code to your daily incremental, the table will be rebuilt every night and ready to analyze. You can find the code for the derived table in the imported Base Daasity files here: //base_daasity/explores/beta/product_repurchase/dynamic_product_repurchase.explore.lkml
Explore is hidden by default
The setup using the Dynamic Product Attribute Picker and the Dynamic Product Attribute dimension are not intuitive, and it's likely much easier to do your own repurchase analysis by duplicating this dashboard or using Explore from here. To lessen the likelihood of setting up an analysis incorrectly using this explore, it is hidden from the explore menu by default.
Was this helpful?