Retention
Overview
The Daasity Retention Dashboard was developed to help you better understand how well your company is retaining customers by getting them to repurchase. Daasity provides merchants with out-of-the-box customer segmentation that can be used as a building block for both understanding your retention performance and also for creating new retention strategies.
This dashboard and the Daasity customer segmentation can help answer the following questions:
How can I segment my customer base to better reach them? Our out-of-the-box customer segmentation gives you an easy way to start segmenting your email / SMS / other retention campaigns.
Which customer segments are contributing to orders and revenue this month? If too much of your revenue is coming from new customers then you may have a retention problem.
What is the average time between purchases for your customers? This can help you decide how often to send emails / SMS campaigns to different segments.
Which products are purchased when customers repurchase? This can help you decide which products to feature in your email / SMS campaigns.

Important notes
We exclude all Wholesale orders and customers from our Retention calculations
The non-buyer customer segment contains all customers for which you have collected an email, but they have not made a purchase. This includes customers that might join your email list through your Shopify site, and customers that make a purchase that is later cancelled or voided.
Deep dive
Performance by customer segment

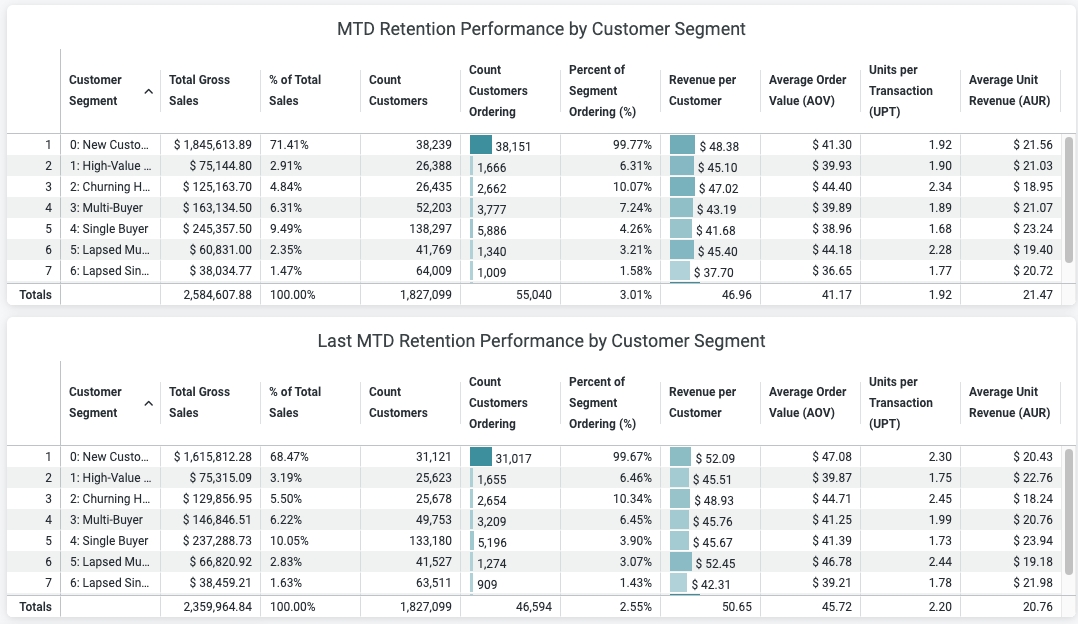
These two visualizations show current and last month to date performance (gross sales, orders, AOV, units per order, and average unit revenue) for each customer segment. For these visualizations, customers are tagged into a certain segment at the beginning of each month and they stay in that segment for the remainder of the month regardless of how many purchases they make. Note that this is NOT how the general customer segmentation works which is updated for every customer every day.
Time between orders

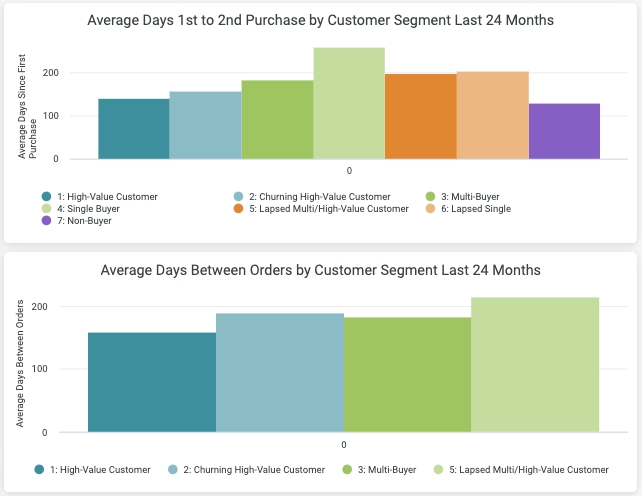
As you start segmenting your retention campaigns, cadence, or how often you are sending campaigns, is an important factor. Some segments may repurchase at shorter or longer time intervals. These visualizations allow you to see exactly when you need to be targeting different segments based on when they are most likely to repurchase.
Customer movement & historical performance

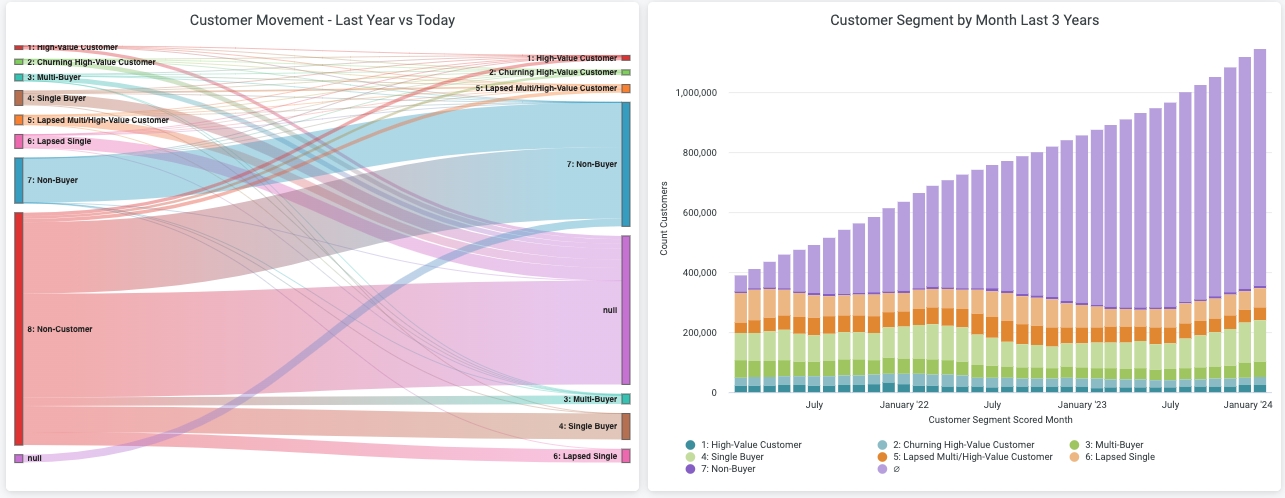
These visualizations allow you to see how customers are moving between segments. It's important to make sure that you have customers moving from your single buyer segment into the multi-buyer segment, and customers moving from your multi-buyer segment into your HVC segment. It's also important to keep an eye on the HVC segment and make sure that these customers aren't all moving to your Churning and Lapsed groups.
Was this helpful?