# Building a Report
Think of building a report as answering a question or "Running a Query." The simpler the question is, the easier the answer will be to retrieve and visualize. You can build several reports and group them together in a Dashboard to visualize the answers to many questions in one place.
The first step in building in a report is to [Choose an Explore](https://help.daasity.com/core-concepts/dashboards/looker-guides/broken-reference) - Daasity has [pre-built Explores](https://help.daasity.com/core-concepts/data-integrations/setup-guides/digital-integrations/amazon-advertising/integration-specifications) for you to choose from - or for More Advanced Users - you can [Build your Own Explores or Modify Daasity's Explores](https://help.daasity.com/technical-docs/looker-guides-dev-lookml/customizing-base-daasity-code). Certain [Integrations have dedicated Explores](https://help.daasity.com/core-concepts/data-models/data-explores/source-specific) as well.
{% hint style="success" %}
Choosing the correct Explore is important when building a report. The Dimensions and Measuesr in each Explore or unique, and specific for the type of report you can create.
{% endhint %}
## Building a Report in Daasity
### Steps for Growth Licenese
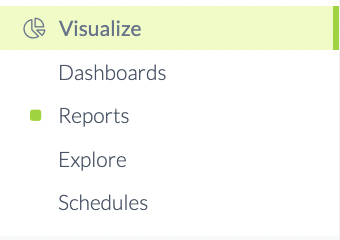
### Navigate to the Reports Menu
Reports
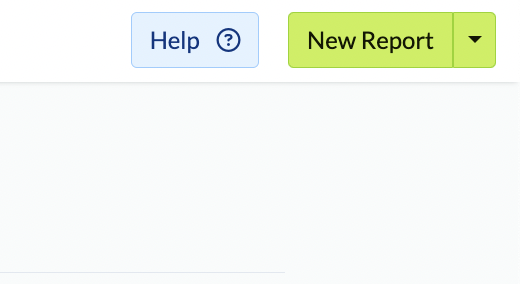
### Click New Report Button
New Report
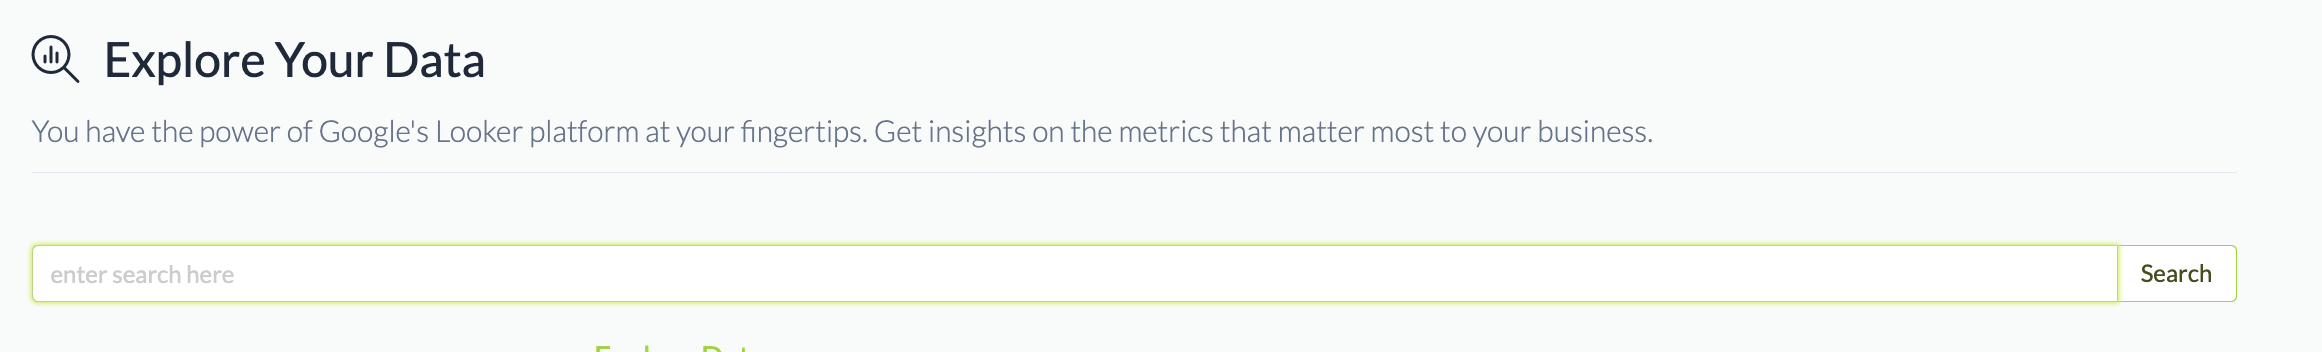
### Choose an Explore
Choose an Explore
{% hint style="success" %}
You can also go Directly to Choose An Explore by Clicking on Explore in the Visualization section of the left-hand Navigation.

{% endhint %}
#### Enterprise License
{% hint style="success" %}
Enterprise Merchants in Looker can go directly to their Explore section and choose an Explore.

{% endhint %}
When Choosing an[ Explore](https://help.daasity.com/core-concepts/data-models/data-explores/digital-analytics-unified) we recommend for your first report to use a common Explore such as Order & Order Line Revenue or Transactional Sales Report. [Please read this help desk page To Understand the difference between these two Explores.](https://help.daasity.com/support/faq/when-to-use-order-line-revenue-or-transactional-sales-report)
{% hint style="success" %}
You can Use a Pre-Existing Report as a Starting Point when Building a New Report. To Do so, Click the ellipses (three vertical dots) located in the top-right corner of every report tile. and Click **Explore From Here**

{% endhint %}
#### Explore From Here
When you "Explore From Here' You will be taken to the Pre-built Report. You can edit the report and
* Save as a New Report
* Save to New Dashboard
* Save to an Existing Dashboard
**This will NOT affect the original Report. - The original Report will remain in-tact.**
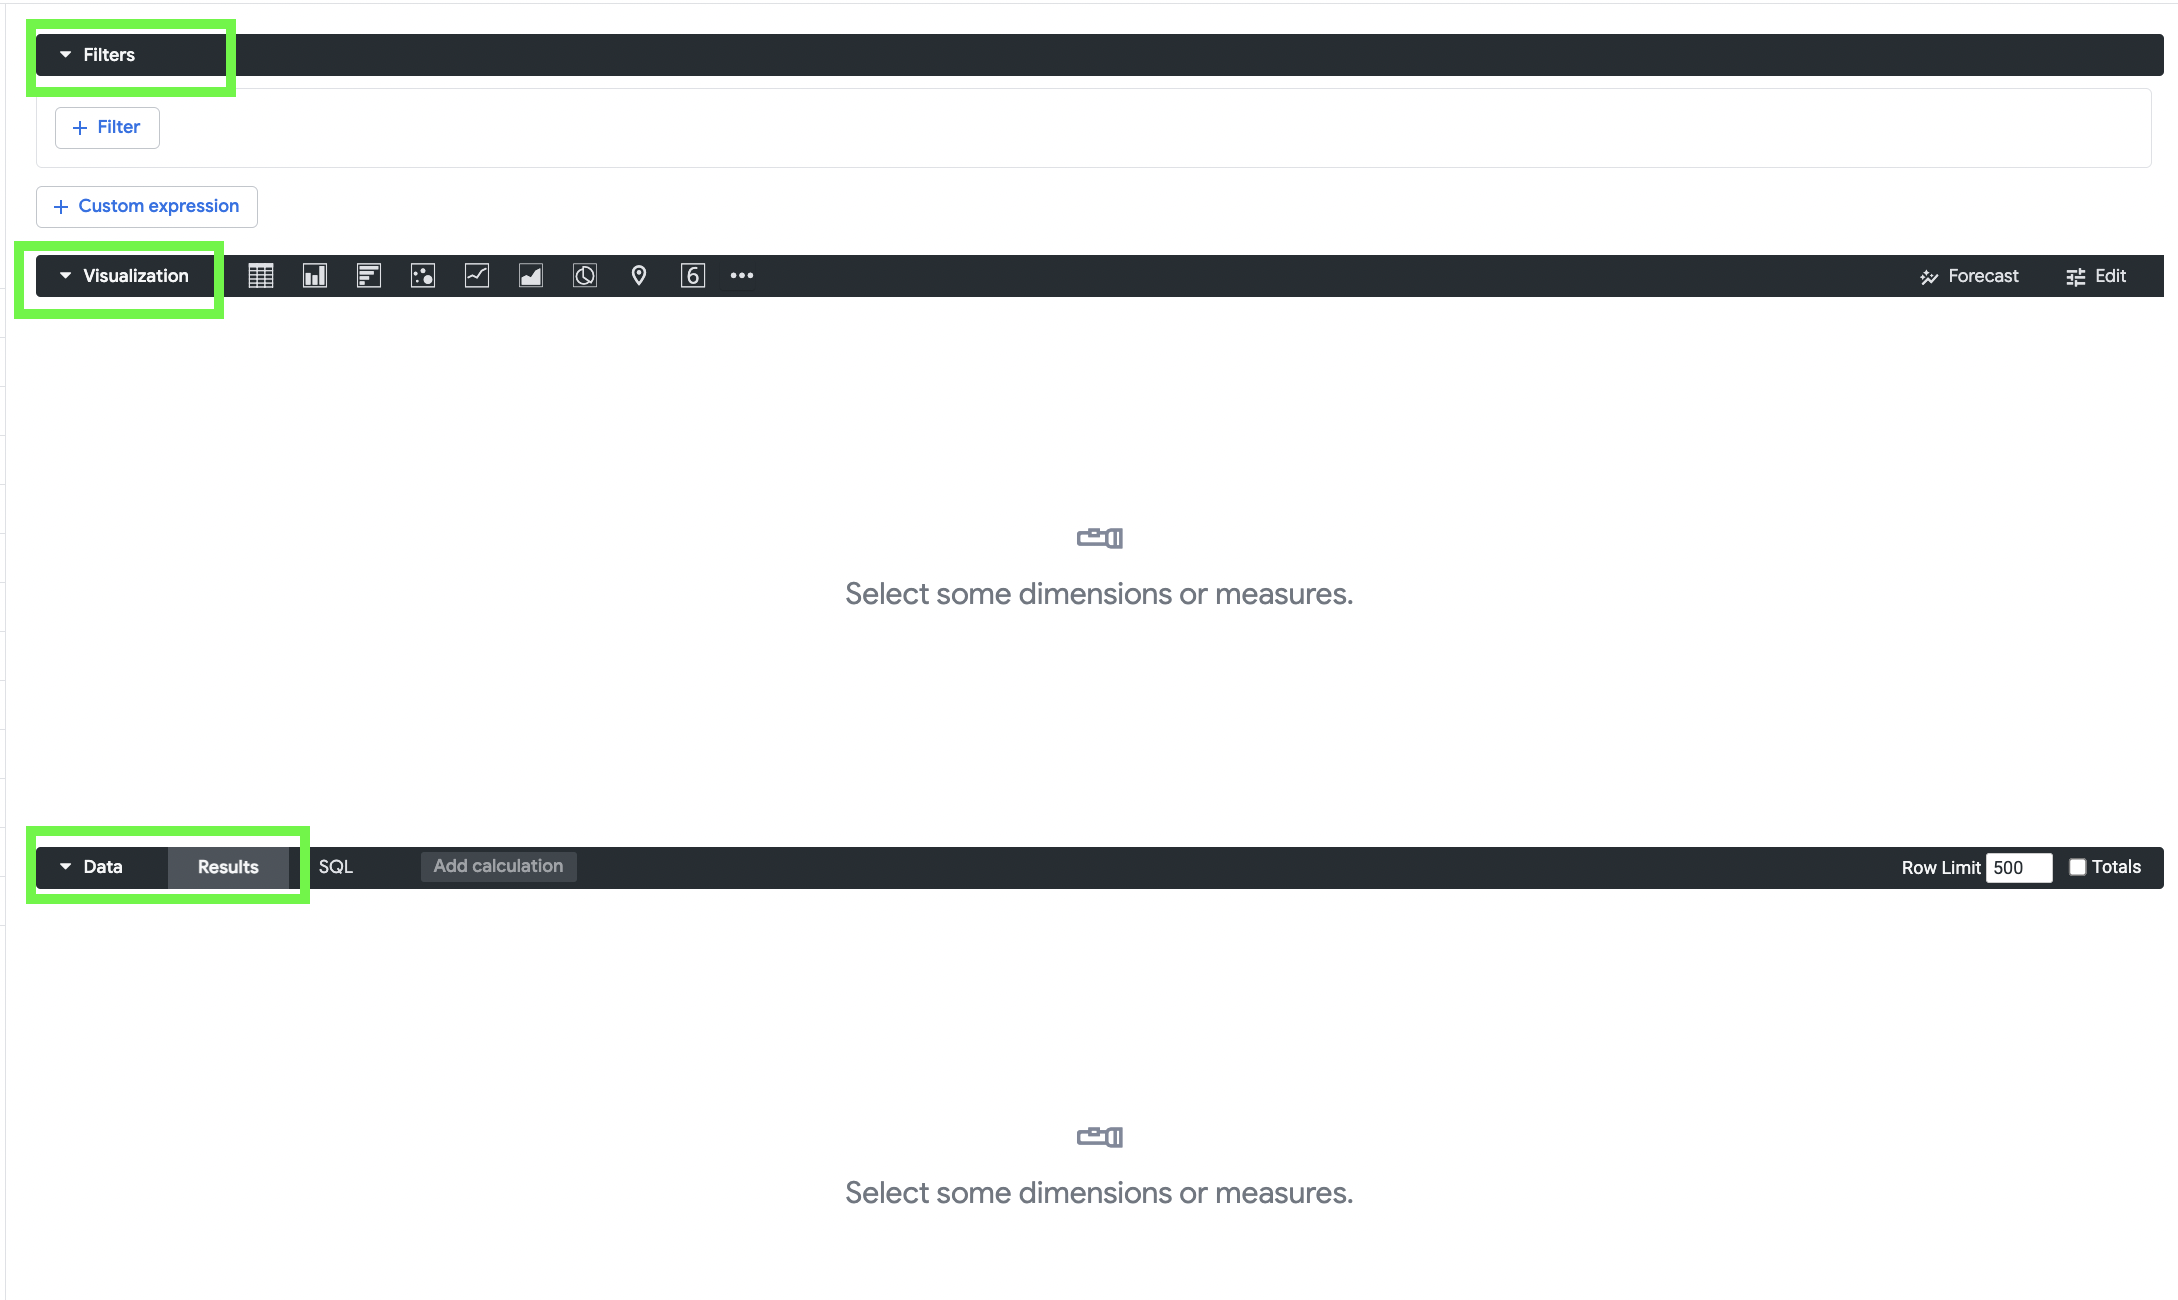
### Sections of the Report
Reports have 3 Main Sections
### Filters: Adding a Filter to report will allow you to Filter on dimensions such as:
* Date (Example: Past 7 Days)
* Date Comparisons (Example: Week over Week)
* SKU Attributes (Example: Product Categories)
* Sales Channels (Example: Amazon vs. Shopify)
### Visualization: How you See the Data
For example:
* Bar Graph
* Table
* Line Graph
* Pie Chart
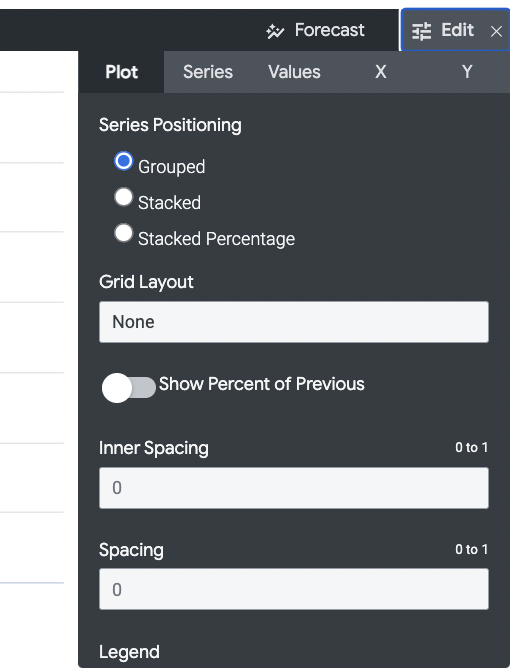
You can edit the Visualization, change colors, axis, how many rows to display etc.
Edit Visualization
### Results: The Raw Data results of your Query
## Add Dimensions and Measures